Hi! For the sake of your convenience, I have divided my article into three chapters:
- Chapter 1. "Let's Get It Installed in a Snap". Here I will tell you how to prepare a High Availability infrastructure and how to set up WooCommerce on it. Spoiler: it's really easy if you use proper tools.
- Chapter 2. "Let's stress it! Is Horizontal Autoscaling good?" Here I will talk about the stress test I ran and the way I adjusted the infrastructure to survive the load. Also, here you can find real costs of a WooCommerce website.
- COMING SOON! Chapter 3. "Let's stress it once again! Actually, Horizontal Autoscaling is good!" Here I will show how to adjust the infrastructure to make Horizontal Autoscaling work perfectly and compare all the previous setups by RPS and pricing. If you need a brief practical guide, then this is it.
You can repeat any step even without repeating other steps. Moreover, you don't need to install any software on your machine (except for Docker but you already have it, right?), you don't need to run any builds (i.e. set up a development environment), you don't need to do programming.
I believe that IT must be an easy thing in 2022.
Chapter 2. Let's Stress It! Is Horizontal Autoscaling Good?
What Stress Test Am I Going to Run?
When we met last time, I installed a High Availability WooCommerce instance. Now the time is ripe for running a stress test and checking if the infrastructure is really HA. I thought that Horizontal Autoscaling would do the job, but surprisingly it failed. So let us get through it all and see why it happened.
I have prepared a simple stress test script for k6.io. The script imitates a behavior of "customers browsing the shop and looking for some products". I.e. the script opens a product card and requests a couple of static files, waits 2-5 seconds, and then repeats it all again. During the test, the number of concurrent users will increase and decrease to emulate "user waves".
You Can Use This Stress Test for Your WooCommerce Instance
Just run the command:
docker run -i grafana/k6 -e DOMAIN_NAME="yourDomain" run github.com/wspaws/woocommerce/stress-test-k6.js
If you want to get those neat graphs I show in the article, use these commands:
git clone https://github.com/luketn/docker-k6-grafana-influxdb.git
cd docker-k6-grafana-influxdb
docker-compose up -d influxdb grafana
docker-compose run k6 -e DOMAIN_NAME="yourDomain" run github.com/wspaws/woocommerce/stress-test-k6.js
The graphs will be available on http://localhost:3000/d/k6/k6-load-testing-results
Don't forget to say "Thank you" to the author of this docker-compose
Test Results
| Infrastructure | p(95) Response Time best - worst | RPS avg. best - worst | Error rate Max served users | App cost | Full cost |
|---|---|---|---|---|---|
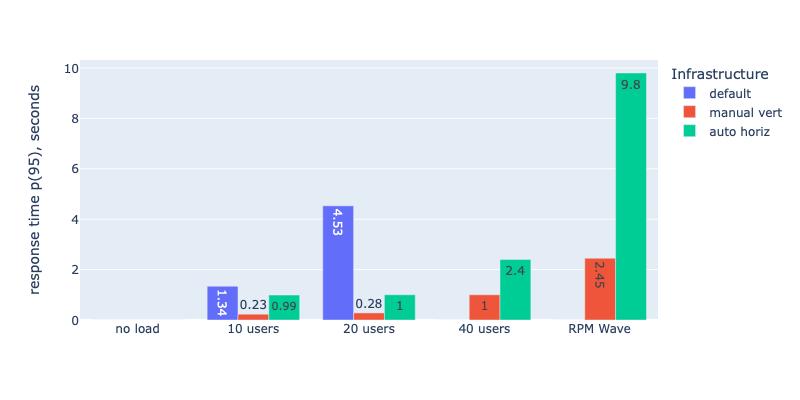
| WSP default: 0.25vCPU, 512Mb RAM, 1 container | 1.34s - 4.53s | 39 - 43 | 80% error rate 40 users | ~$10-$22/mo | ~$46-$58/mo |
| x4 manual vertical scaling: 1vCPU, 2Gb RAM, 1 container | 230ms - 2.45s | 50 - 570 | 40% error rate ~190 users | ~$36-$44/mo | ~$72-$83/mo |
| x4 auto horizontal scaling: 0.25 vCPU, 512Mb RAM, 1-4 containers | 990ms - 9.8s | 43 - 511 | 65% error rate ~250 users | ~$17-$39/mo | ~$53-$78/mo |
What?! Horizontal Autoscaling makes no sense?! Look at the numbers! Horizontal Autoscaling is so much worse in terms of performance!
But why? Is that real? Read the Detailed Tour below, and try to guess what was the reason and how to fix it. Or wait till the last chapter (Let's Stress It Once Again: Actually Horizontal Autoscaling is Good!) for the answer.
Detailed Tour
Stress Test
There are several major software used for stress testing and the most well-known is Apache Benchmark. I use k6.io because of its flexibility. BTW, there is a list of similar testing software so you can pick another tool that fits you best.
I'd like to get the main page in 2.5 seconds (in 95% of all cases) and static files in 1 second. So I've applied these expectations to my script. It's OK for some requests to fail but if more than 80% of the requests fail, the test will stop because it will be pointless to continue. The 80% error rate means that the website didn't survive.
The number of users will double after 20 minutes of the test. Then in 20 minutes, it will double again reaching 40 users. The increase will be smooth - 4 minutes of the linear ramp up. The last step of the test is "RPS Wave", which means that the RPS (request per second) will rise up and down in a greater extend. I think that given the default resources, my website will not survive this load.
When my website dies, I'm going to analyze what's happened and update the infrastructure (it's easy using WSP) to get my website running despite this killing load.
You can run the script using the following command:
docker run -i grafana/k6 -e DOMAIN_NAME="yourDomainWithWooCommerce" run github.com/wspaws/woocommerce/stress-test-k6.jsGit cloning is not a required thing to do here. If you want to change some parameters or change the script itself, you can use the repository: https://github.com/wspaws/woocommerce.
I've also set up a machine to visualize execution of the test (I've done it as described in this article).
First Run: Default Resources
Default resources: 0.25v CPU, 512Mb RAM, and 1 container.
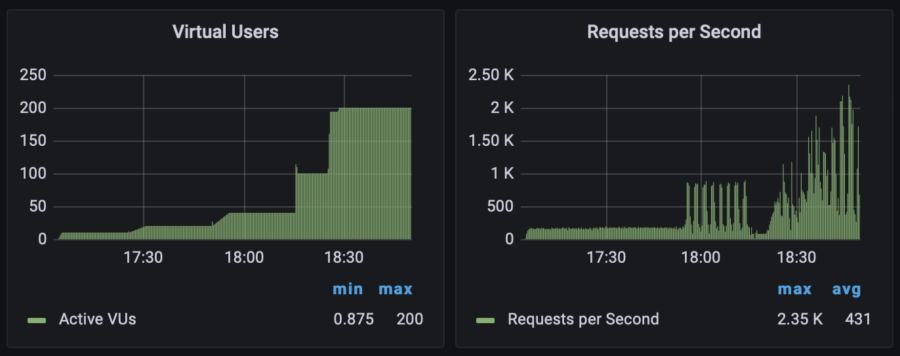
Test Execution Graphs
Here you can view the number of users simultaneously visiting my website as well as requests per second performed by the script. It doesn't mean that the website survived the load, these graphs just show how the stress test was going:
I need two metrics to keep an eye on. The first one is "Error rate" and the one second is "Response time". On the graph below, you can notice that the response time went bad after 17:30, when the number of users doubled from 10 to 20.
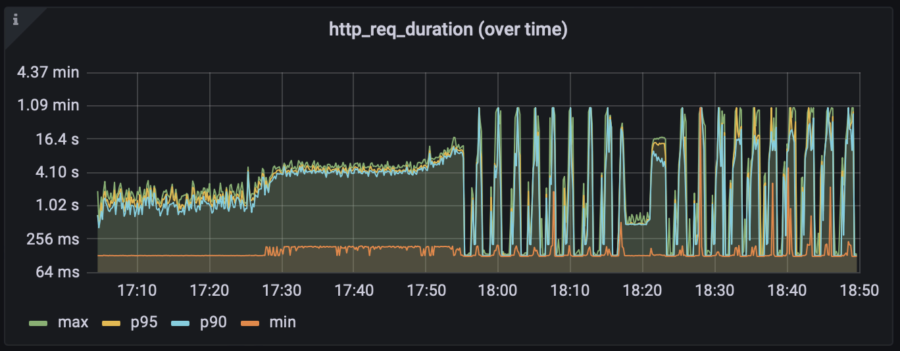
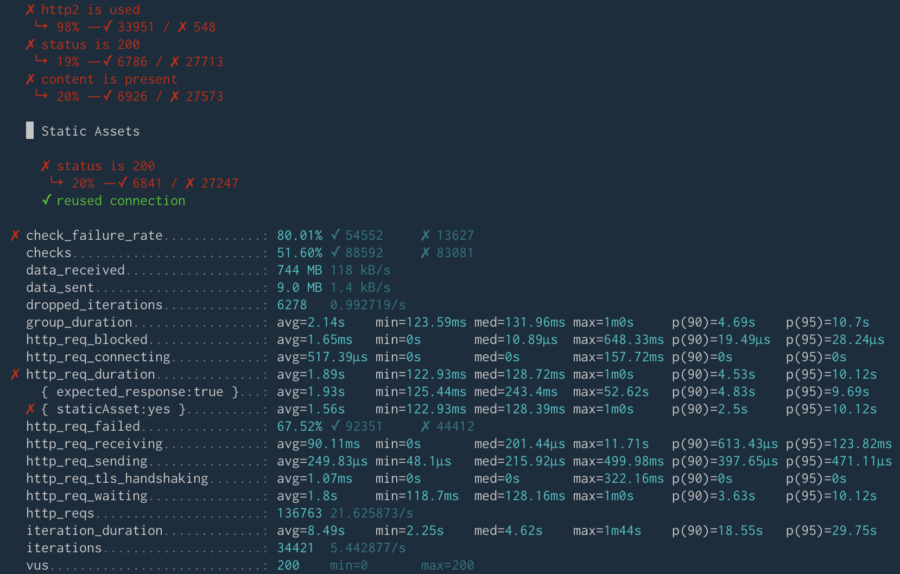
Eventually, the test stopped at 80% error rate, which means that my website did not survive.
My WooCommerce Monitoring
OK, we have explored the graphs from the point of view of the stress test. Remember that I've set up the stress test monitoring manually.
Now let's take a look at the situation from the perspective of the website. But how to set up the website monitoring? WSP already got it covered. You don't need to do anything manually, it's fully automatic for every application you set up via WSP.
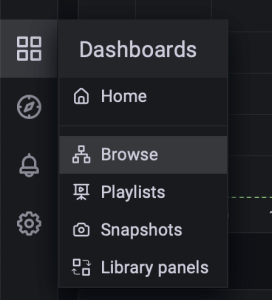
So all I need to do is to click the Monitoring button in the WSP user interface:
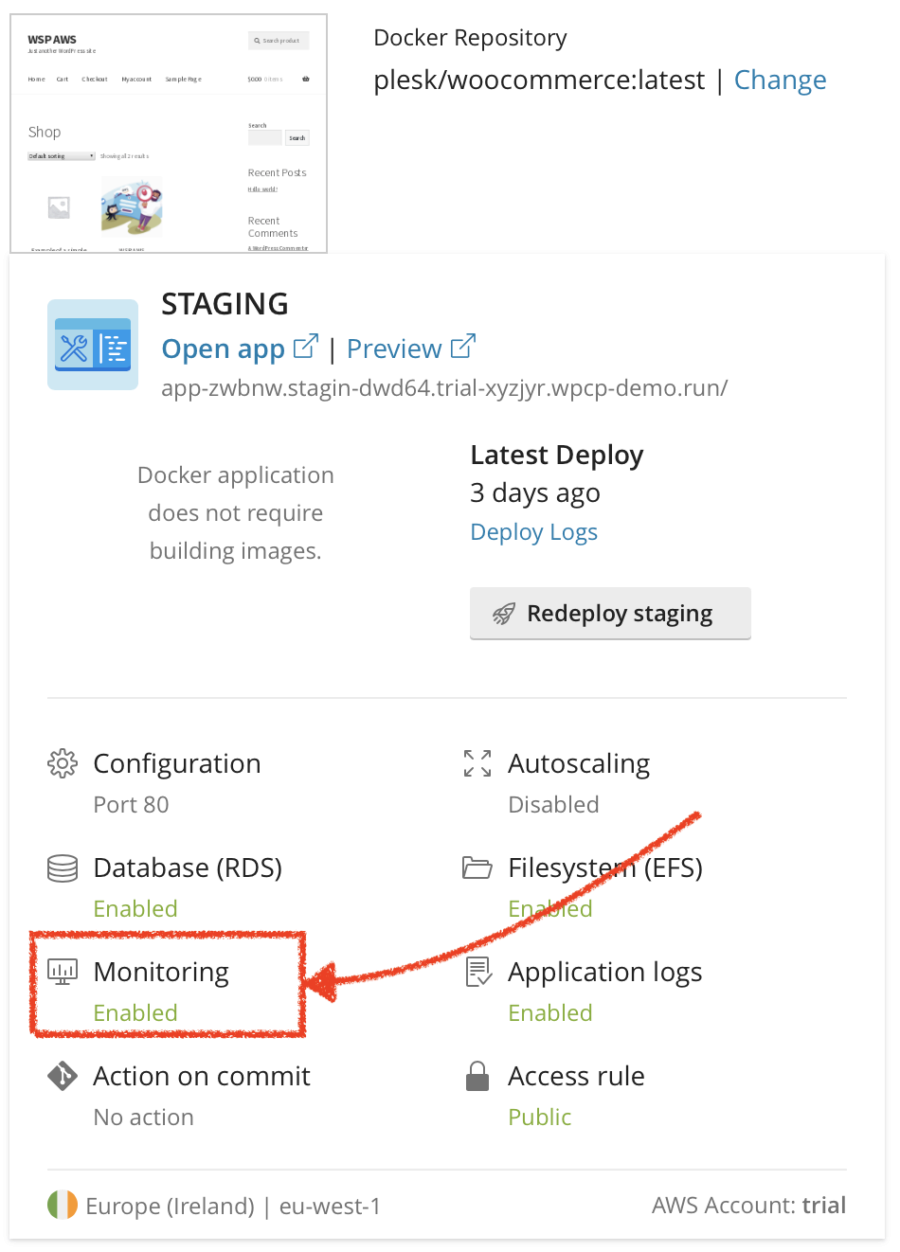
Here you can view the default dashboard (created automatically by WSP) containing all the data necessary to figure out what happened under the load. I found the default dashboard OK for my purpose so I decided not to create my own dashboard. Although, you can create and configure your own dashboard if required.
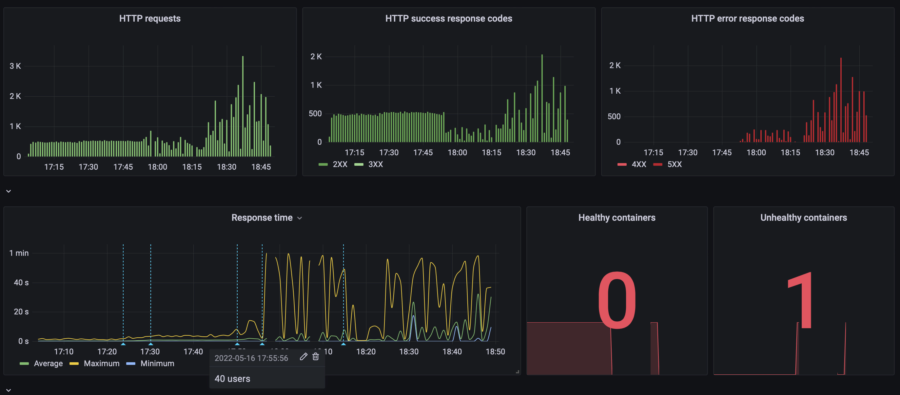
As you can see on this graph, my website started dying since 17:55 when the website's load rose from 20 to 40 concurrent users. Let's take a look at the resources consumption:
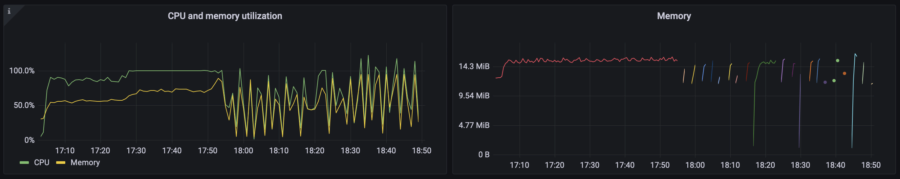
Oh, CPU usage hits 100%. That's not good at all. And that's the reason for the website to die. The Memory graph (RAM) contains many lines with different colors, which is the visual representation of how the High Availability infrastructure actually works. Do you remember the previous chapter where I explained why my website remains operational even during an update?
In this case, I had a single container. When a container works OK (i.e. the container answers to the health checks), the balancer routes the traffic to this container. If the container is considered unhealthy as it happened with my website, the balancer starts a new container, re-routes the traffic to it, and then turns off that unhealthy one.
However, the new container could not handle so many requests because of the insufficient CPU performance. So the situation repeated again and again.
Those short color lines on the Memory graph are RAM consumption of the containers that started and died almost instantly under the load.
Let's make sure that my Database is feeling good and CPU overuse is the only reason. To do so, take a look at the RDS metrics on the default WSP dashboard:
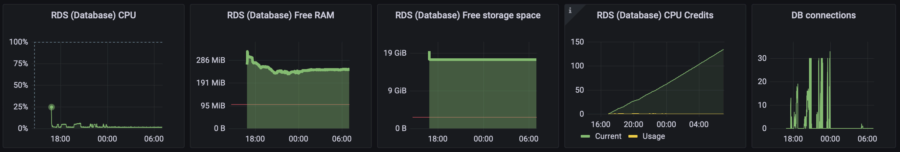
Yep, RDS is pretty OK with such load.
Costs
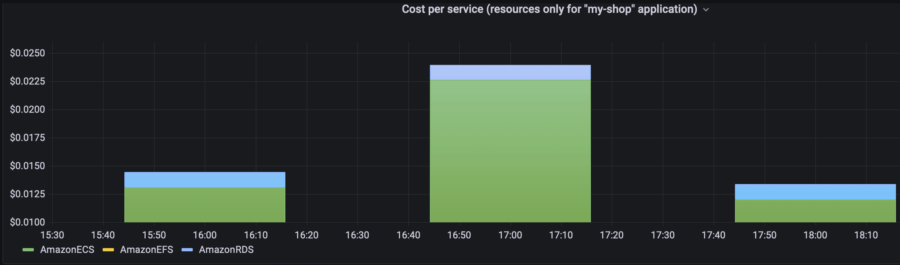
Along with health metrics, WSP brings the graphs with billing information to Grafana connected to my WooCommerce. Let's see the costs of the website under such load.
Note: The billing dashboards are recalculated once a day. It's the way AWS works.
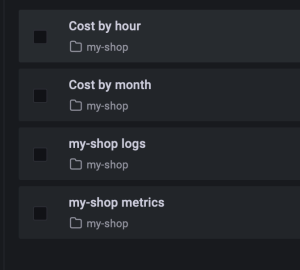
My stress test took 2 hours (moreover, the RPS Wave phase was performed during the second hour) so the "Cost by hour" view is quite useful in my case.
The dashboard contains two graphs because several apps can be run in the same environment. An environment includes some shared resources required for the infrastructure (e.g., Load Balancer, DNS, and so on) plus "Monitoring" and "Logging". On the graph below, you can view the graphs for the all tests that I ran. That's FYI, I just wanted to show how it could look:
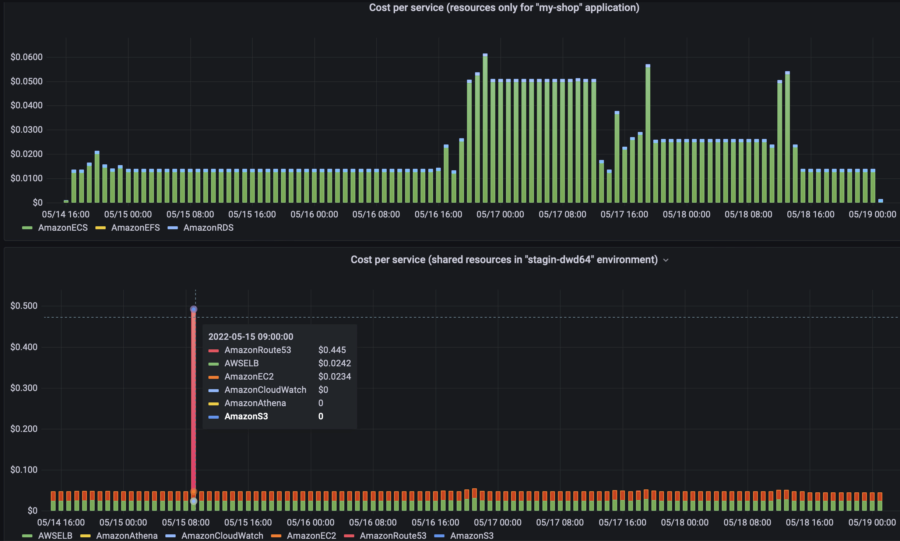
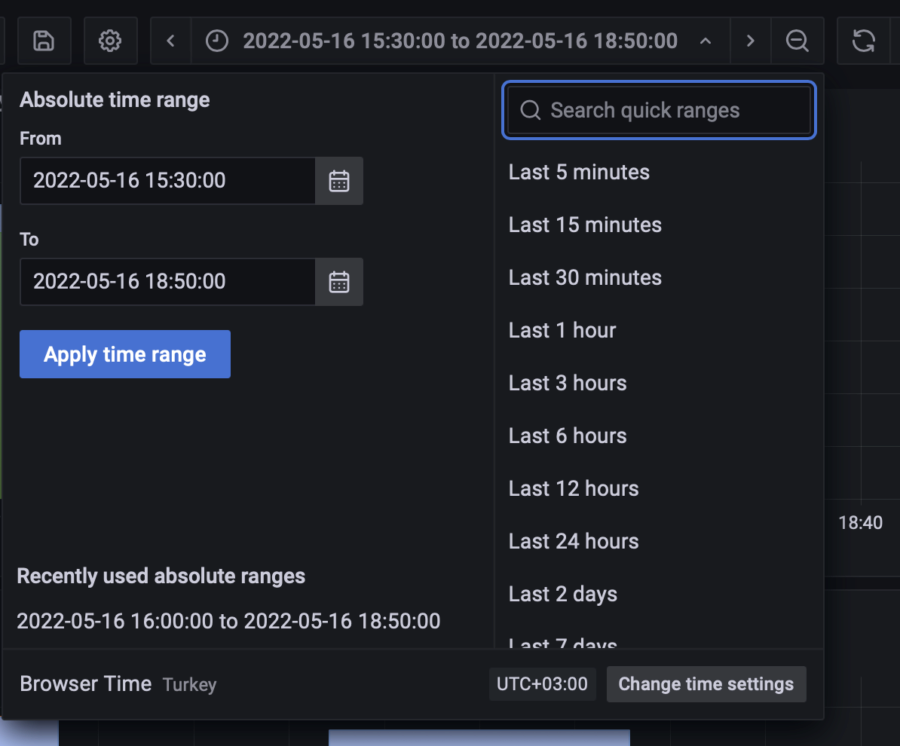
For execution of this particular test, I need only a part of this graph. With Grafana, I can select the required period and focus on it, or I can specify the exact time. As you can see, the application itself costs me $0.014/hour (=$10/mo) when the load is quite low. During the first 3 phases of the stress test, the app costs me $0.03/hour (=$22/mo). The environment's cost is $0.05/hour * 24 * 30 = $36/mo.
Second Run: Let's Add Sore Resources (Vertical Manual Scaling)
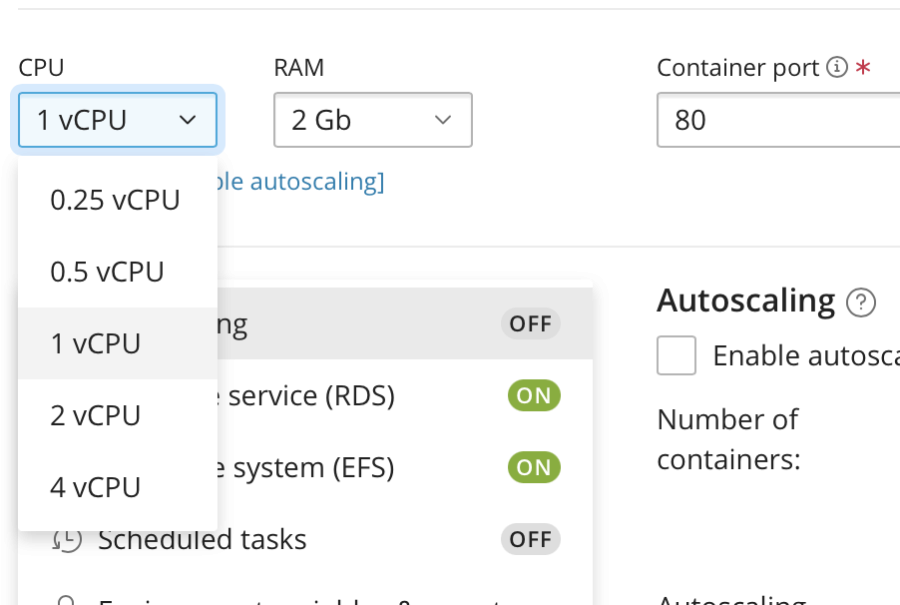
What can I do to make my WooCommerce survive more users? Of course, I can increase the amount of resources, e.g. CPU and RAM. Well, why not. Let's do it and run the test again.
I am setting CPU to 1vCPU, which is x4 times more powerful than it was in the previous test. RAM is set to 2Gb automatically because AWS ECS/Fargate doesn't allow using 0.5vCPU with 512Mb RAM. Since I've changed the parameters, now I need to deploy the changes. Don't worry to miss this aspect, WSP will remind you about it.
After deploying the changes, I started the same test. You can explore the results in the summary table below.
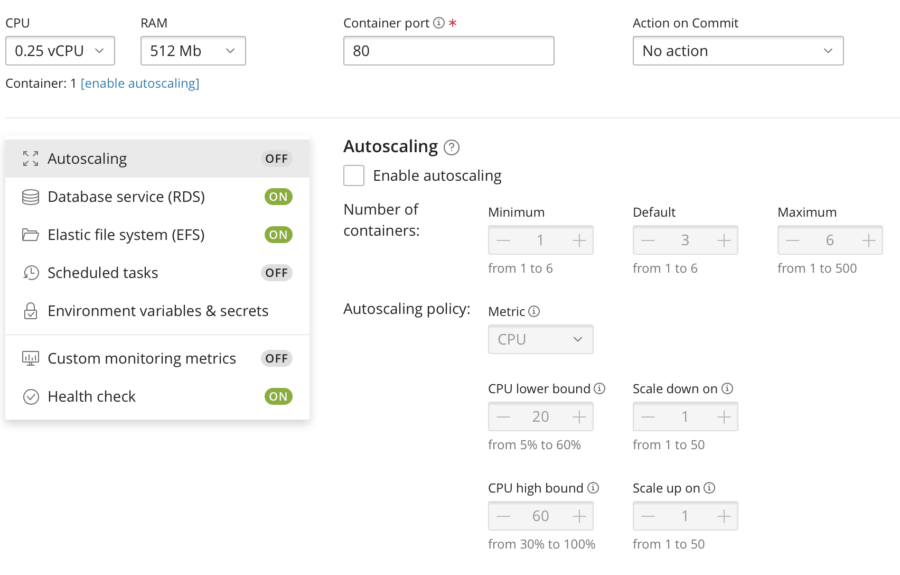
Third Run: Horizontal Autoscaling
Another way to prepare for the load is to configure Autoscaling. We know that CPU performance is the problem so let's configure the system so that it will add more containers when CPU is about to be overloaded. Having WSP, it's a five-seconds task.
I am restoring the resources to its lowest values and enabling "Autoscaling":
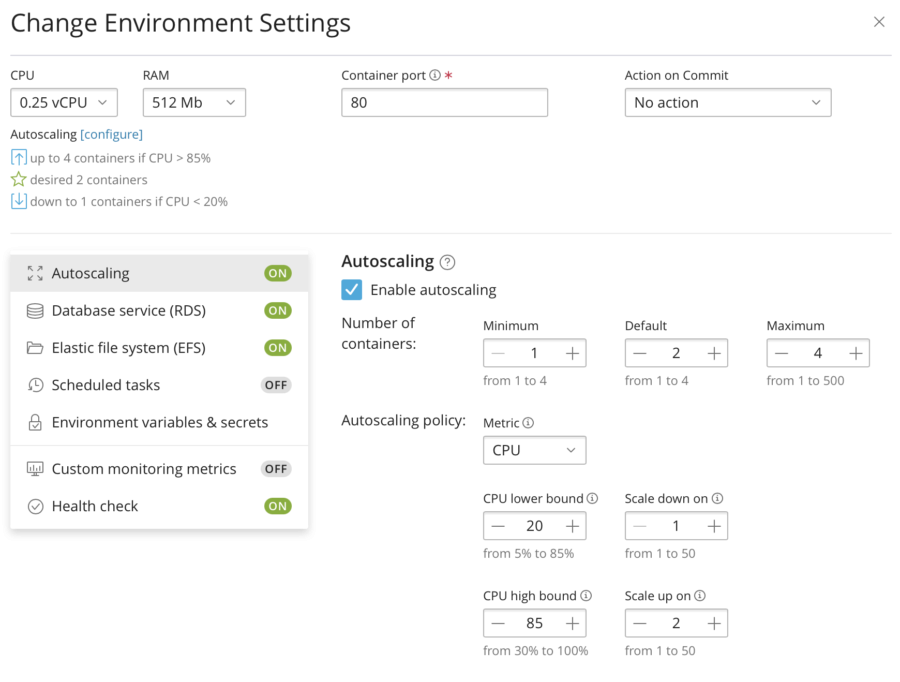
So if the CPU load (average per all running containers) goes above 85%, AWS ECS/Fargate should add up to 4 containers (we've used x4-vertical scaling so let's now try the same x4 for horizontal scaling). If the CPU load gets lower than 20%, the containers will be stopped (to save my money).
Now I shall wait for deploy and run the test again.
Summary
| Infrastructure | Phase | Metrics | Graphs: load | Graphs: app | App cost | Full cost |
|---|---|---|---|---|---|---|
| Default: 0.25vCPU, 512Mb RAM 1 container, no autoscaling | No load | $0.014/h =$10/mo | $46/mo | |||
| 10 users | p(95) response time: 1.34s RPS: max 53, avg 39 | 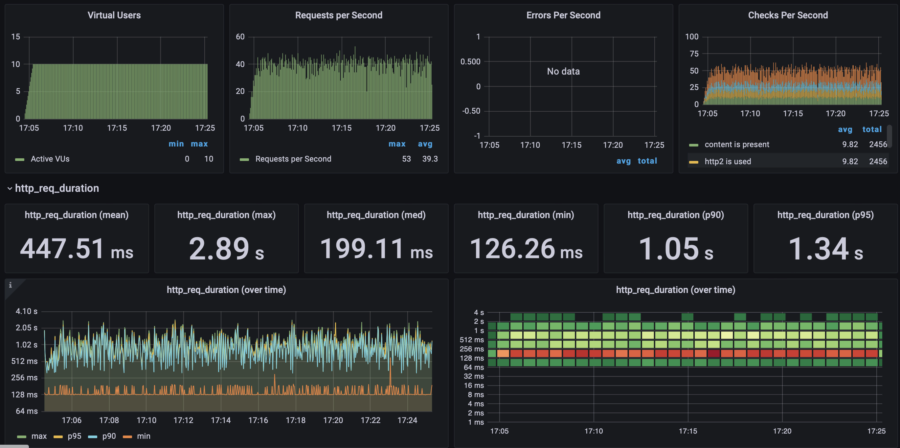 | 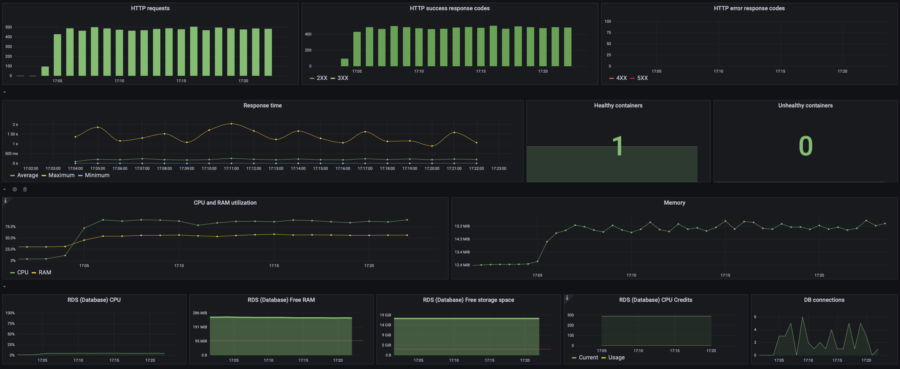 | $0.03/h =$22/mo | $58/mo | |
| 20 users | p(95) response time: 4.53s RPS: max 67, avg 43 | 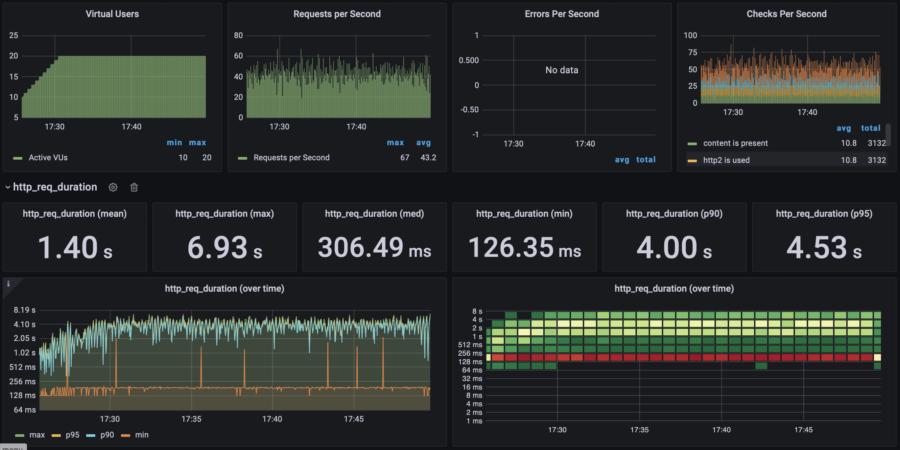 | 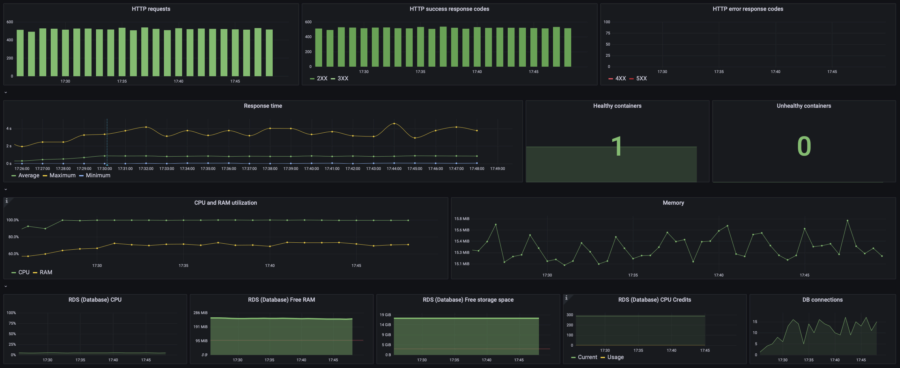 | |||
| 40 users | Failed, >80% error rate | - |  | - | - | |
| RPS Wave | N/A | - | - | |||
| x4 manual vertical scaling: 1vCPU, 2Gb RAM 1 container, no autoscaling | No load | $0.05/h =$36/mo | $72/mo | |||
| 10 users | p(95) response time: 230ms RPS: max 70, avg 50 | 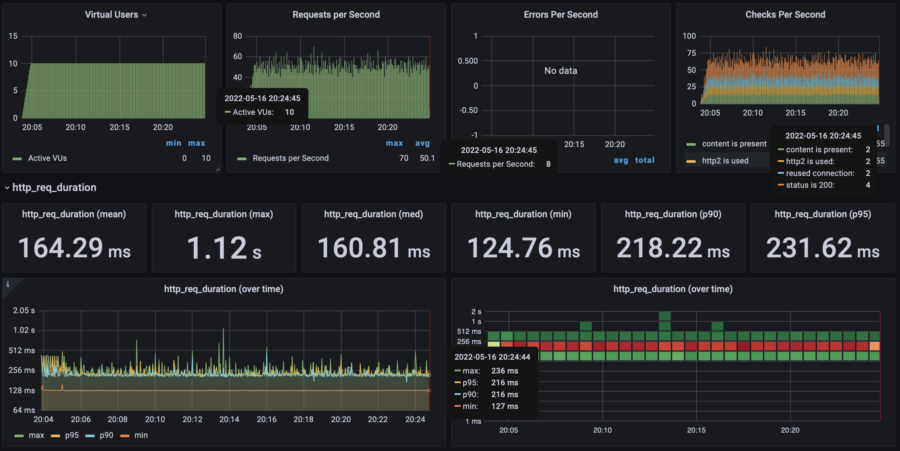 |  | $0.054/h =$39/mo | $78/mo | |
| 20 users | p(95) response time: 280ms RPS: max 124, avg 96 | 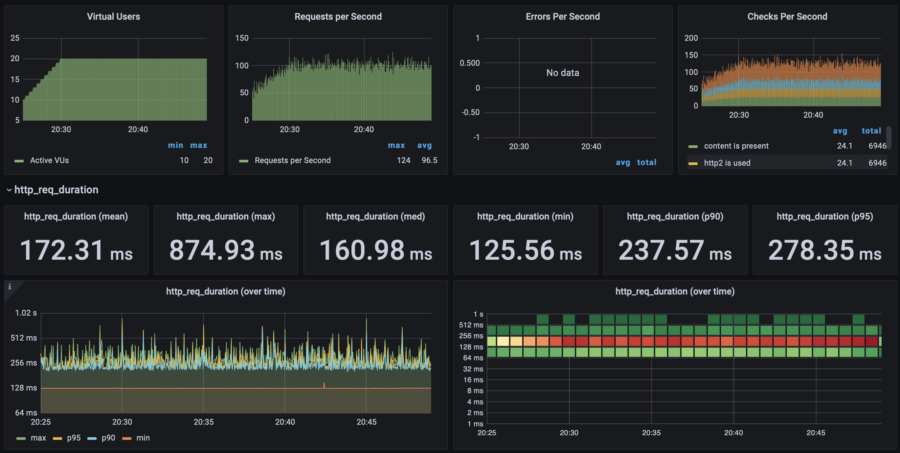 | 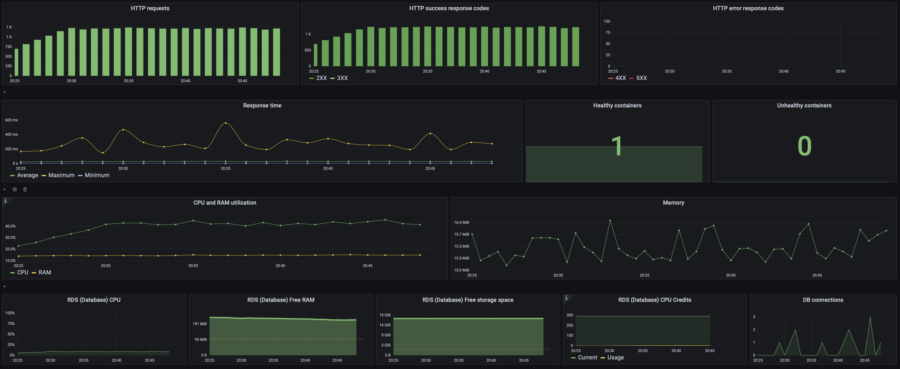 | |||
| 40 users | p(95) response time: 1s RPS: max 204, avg 166 | 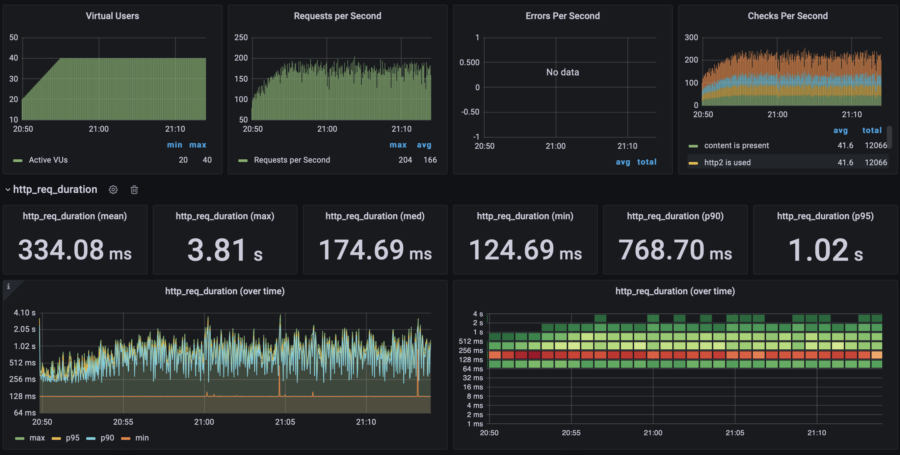 | 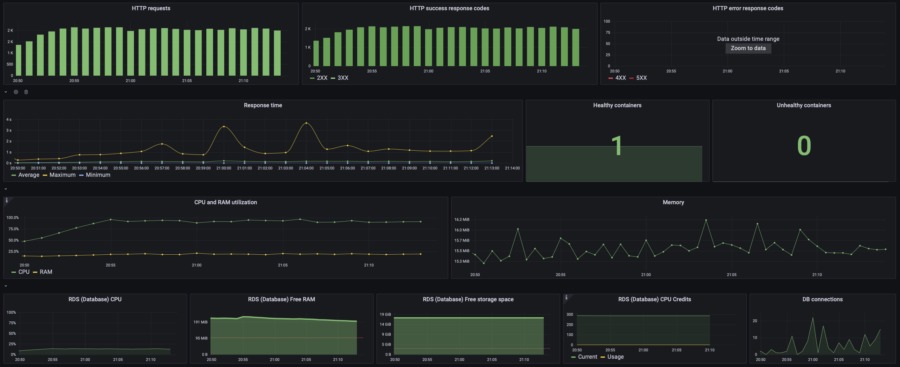 | |||
| RPS Wave | p(95) response time: 2.45s RPS: max 1300, avg 570 40% error rate | 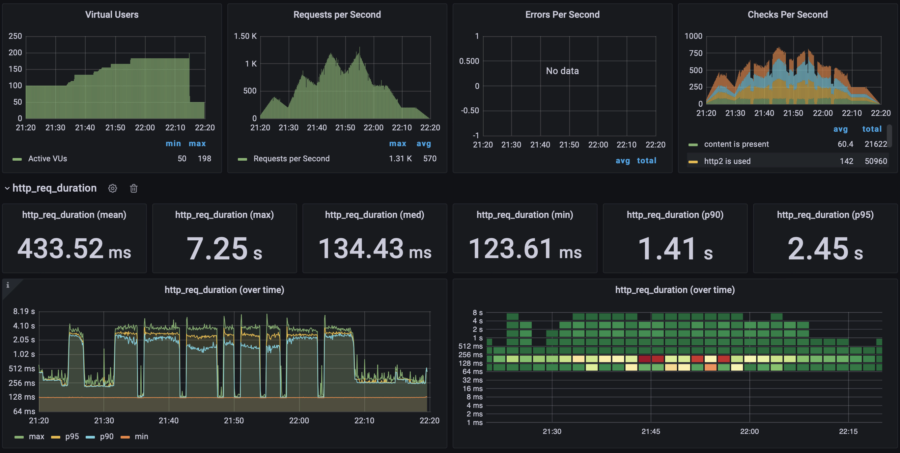 | 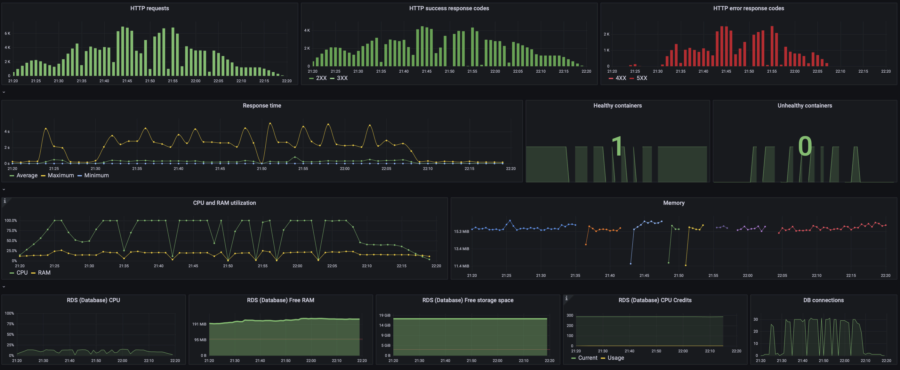 | $0.061/h =$44/mo | $83/mo | |
| x4 auto horizontal scaling: 0.25 vCPU, 512Mb RAM 1-4 containers, scale up on 85% CPU, scale down on 20% CPU | No load | $0.024/h =$17/mo | $53/mo | |||
| 10 users | p(95) response time: 990ms RPS: max 63, avg 43 | 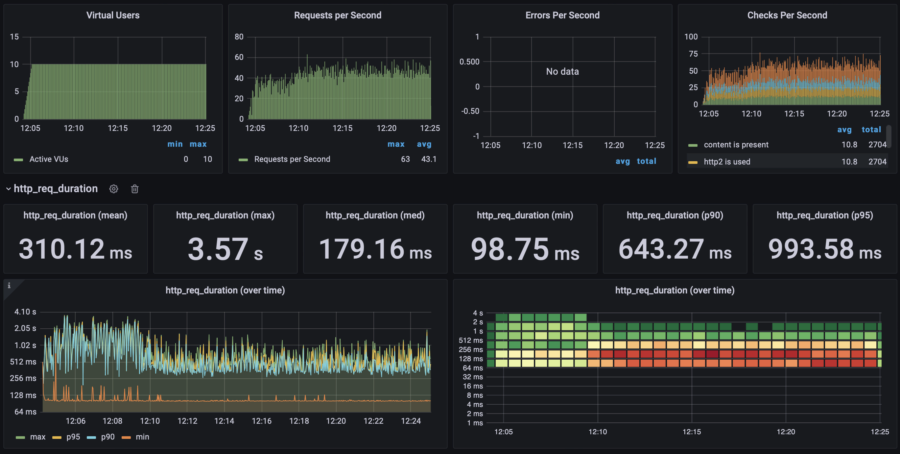 | 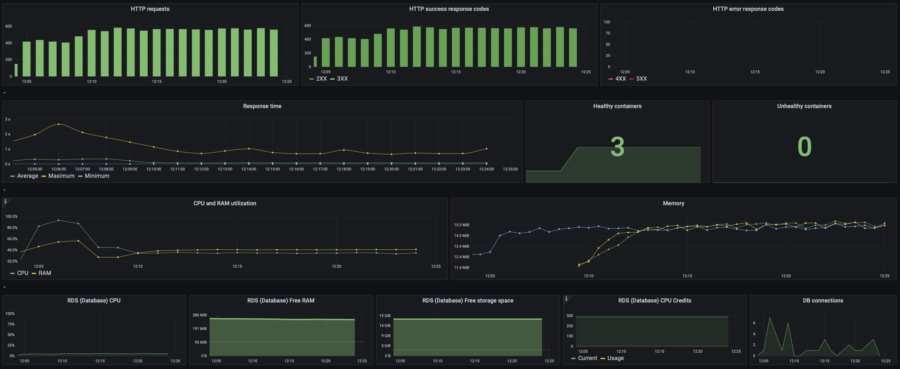 | $0.05/h =$36/mo | $75/mo | |
| 20 users | p(95) response time: 1s RPS: max 104, avg 84 | 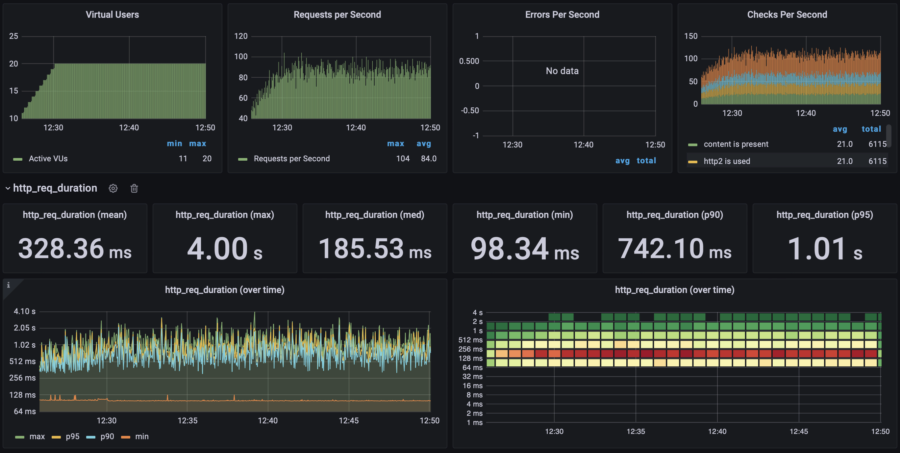 | 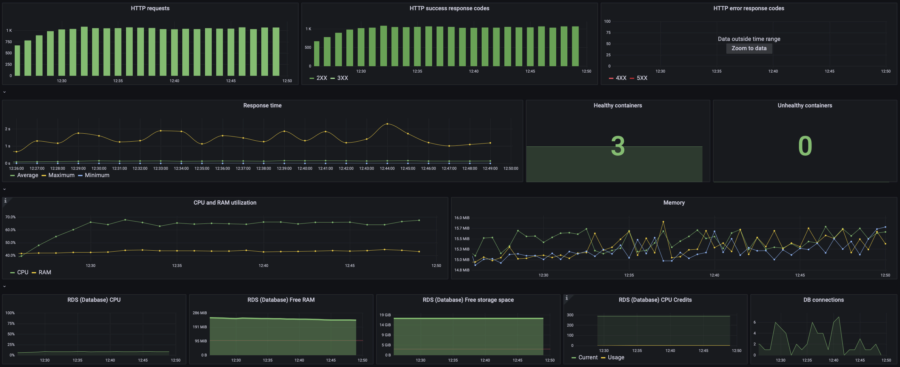 | |||
| 40 users | p(95) response time: 2.40s RPS: max 188, avg 136 | 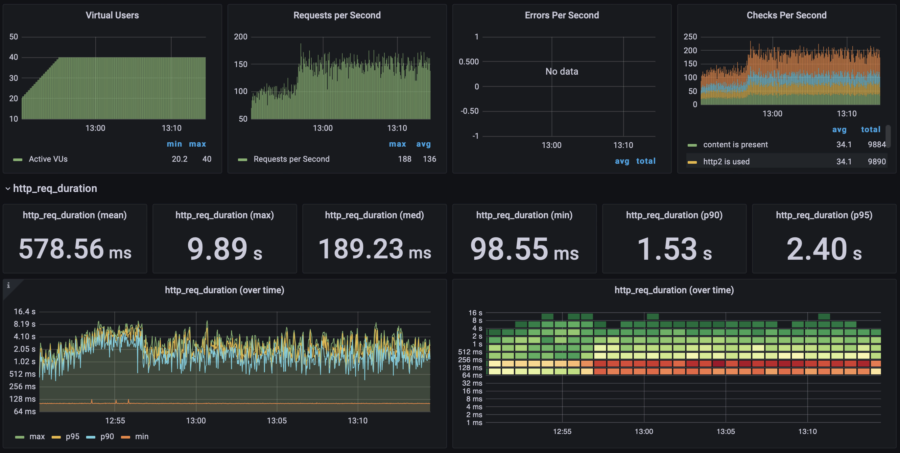 | 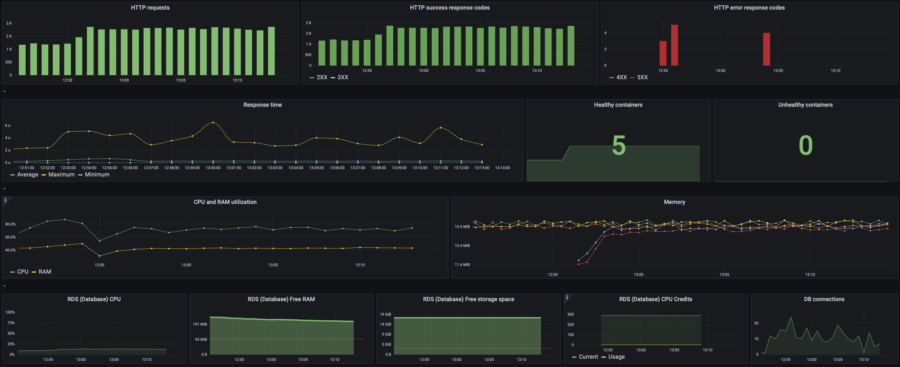 | |||
| RPS Wave | p(95) response time: 9.8s RPS: max 1300, avg 511 65% error rate | 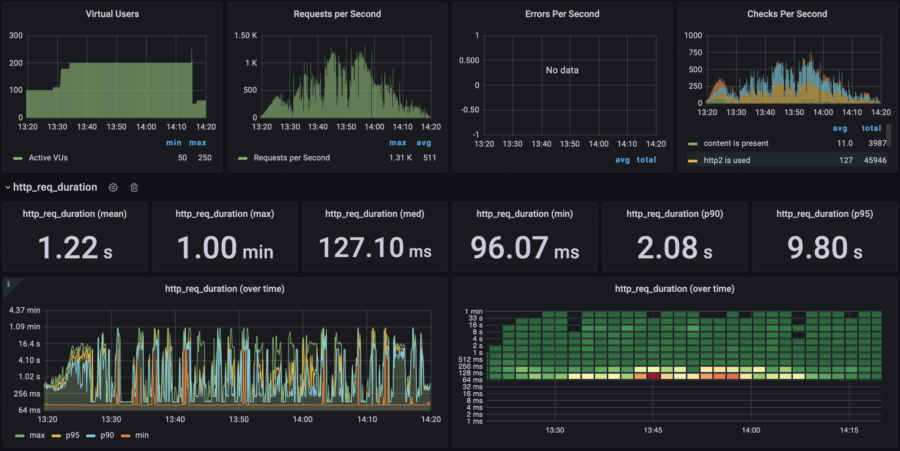 | 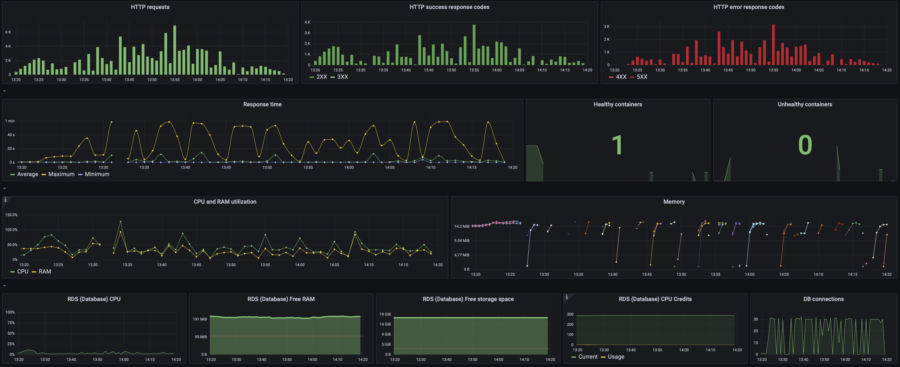 | $0.054/h =$39/mo | $78/mo |
Response time (the lower the better)
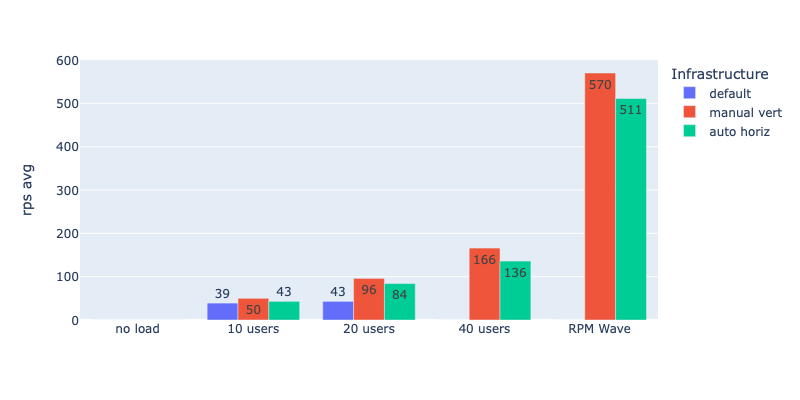
Average RPS (the higher the better)
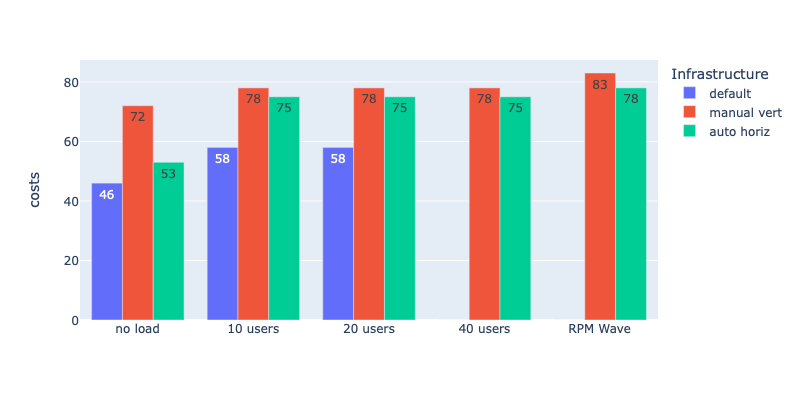
Costs (the lower the better)
Conclusion
According to my stress test, Horizontal Autoscaling makes no sense in terms of performance. It shows much worse results compared to Manual Vertical Scaling. Yes, autoscaling is a bit cheaper, and yes, you can set it up and not worry about the load (with manual vertical scaling, you have to monitor the load and react manually or acquire a large lot of resources from the very beginning and pay for them even if the load is low).
But that sounds ridiculous! Robots lose a home game against humans? Nonsense!
Do you understand why using Horizontal Autoscaling would be a loss? What was the mistake? How to fix it? Share your opinion in the comments and wait for the next chapter where I will answer these questions!
For the sake of your convenience, I have divided my article into three chapters:
- Chapter 1. "Let's Get It Installed in a Snap". Here I will tell you how to prepare a High Availability infrastructure and how to set up WooCommerce on it. Spoiler: it's really easy if you use proper tools.
- Chapter 2. "Let's stress it! Is Horizontal Autoscaling good?" You're here.
- COMING SOON! Chapter 3. "Let's stress it once again! Actually, Horizontal Autoscaling is good!" Here I will show how to adjust the infrastructure to make Horizontal Autoscaling work perfectly and compare all the previous setups by RPS and pricing. If you need a brief practical guide, then this is it.